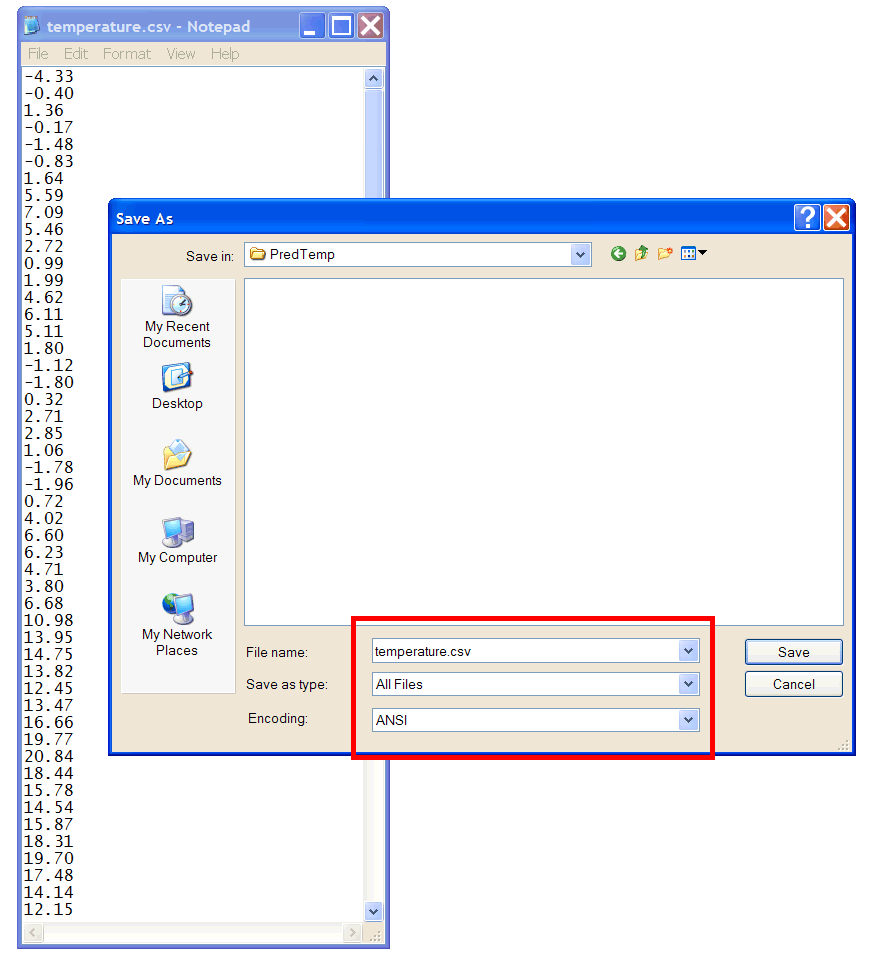
 Notepad Open Notepad a type one temperature value in each row; save the file as temperature.csv in the folder just created (be sure to save the file as temperature.csv and not temperature.csv.txt)
| Tip |
| In this section, an artificial neural network will be designed and trained to predict a temperature value on a time series: y[0], y[1], y[2]... y[n-1] |
| Problem 1 |
| Create a Neural Lab project called SimplePred to predict temperature in small city in Europe (You may select the Prediction option for the network application in the New Project dialog.) The temperature in this city has been sampled as shown: -4.33, -0.40, 1.36, -0.17, -1.48, -0.83, 1.64, 5.59, 7.09, 5.46, 2.72, 0.99, 1.99, 4.62, 6.11, 5.11, 1.80, -1.12, -1.80, 0.32, 2.71, 2.85, 1.06, -1.78, -1.96, 0.72, 4.02, 6.60, 6.23, 4.71, 3.80, 6.68, 10.98, 13.95, 14.75, 13.82, 12.45, 13.47, 16.66, 19.77, 20.84, 18.44, 15.78, 14.54, 15.87, 18.31, 19.70, 17.48, 14.14, 12.15, 12.02, 14.87, 16.71, 16.42, 13.64, 11.91, 11.91, 15.14, 18.40, 20.27, 19.46, 18.17, 18.52, 21.46. Create a data file using comma separated values using notepad |
| Solution 1 |
 Notepad Open Notepad a type one temperature value in each row; save the file as temperature.csv in the folder just created (be sure to save the file as temperature.csv and not temperature.csv.txt) Notepad Open Notepad a type one temperature value in each row; save the file as temperature.csv in the folder just created (be sure to save the file as temperature.csv and not temperature.csv.txt) |
| Problem 2 |
| Add the Temperature.lab file to plot the temperature series. |
| Solution 2 |
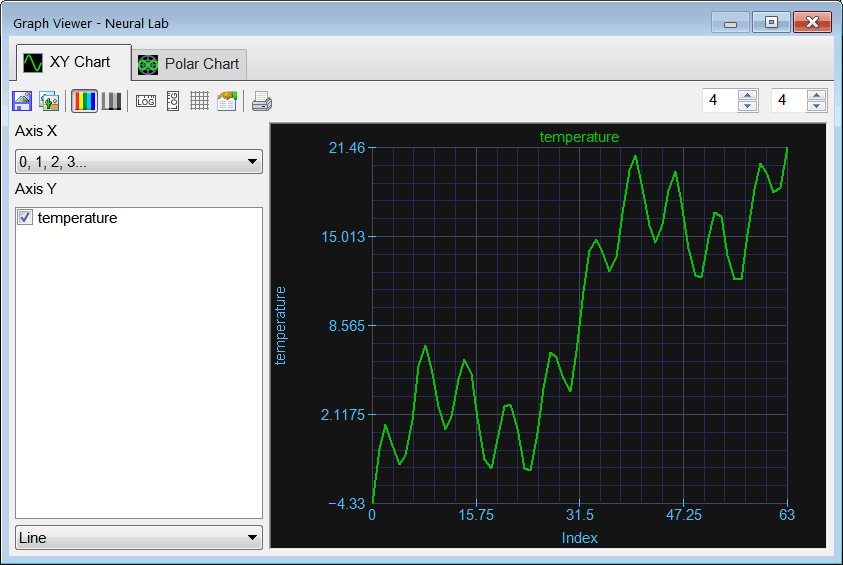
Afger editing the file, run the program and  Graph click the button to open the graph viewer and select the options of the viewer as shown in the figure. Graph click the button to open the graph viewer and select the options of the viewer as shown in the figure. |
| SimplePred\Temperature.lab |
| Vector temperature; temperature.Load(); XyChart chart; chart.AddGraphY(temperature, "Temperature", 1 , 1, 0, 255, 0); chart.AutoScaleX(false); chart.AutoScaleY(false); chart.SetColorMode(2); chart.SavePDF(0.0); chart.SaveAndShow(); |
| Problem 3 |
| (a) Build a training set for prediction for an ANN with five inputs. (b) Design and train an ANN for prediction of the temperature. (c) Predict the future temperature value. |
| Solution 3 |
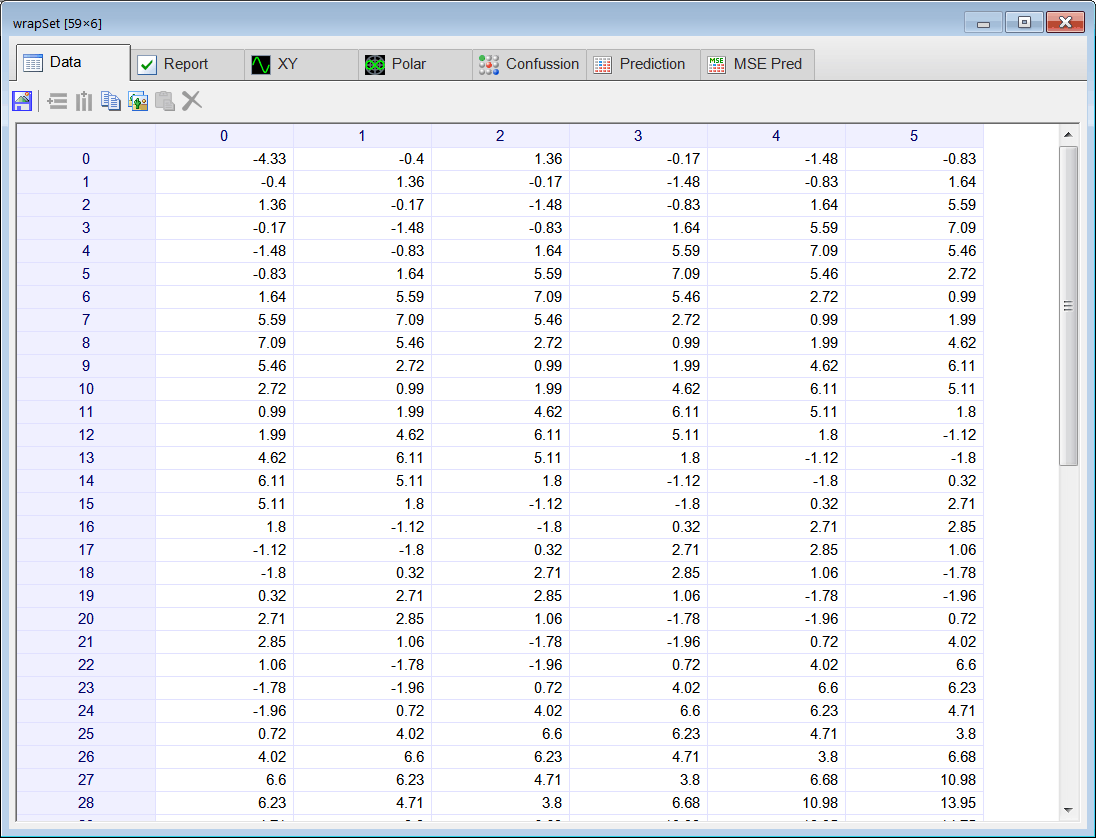
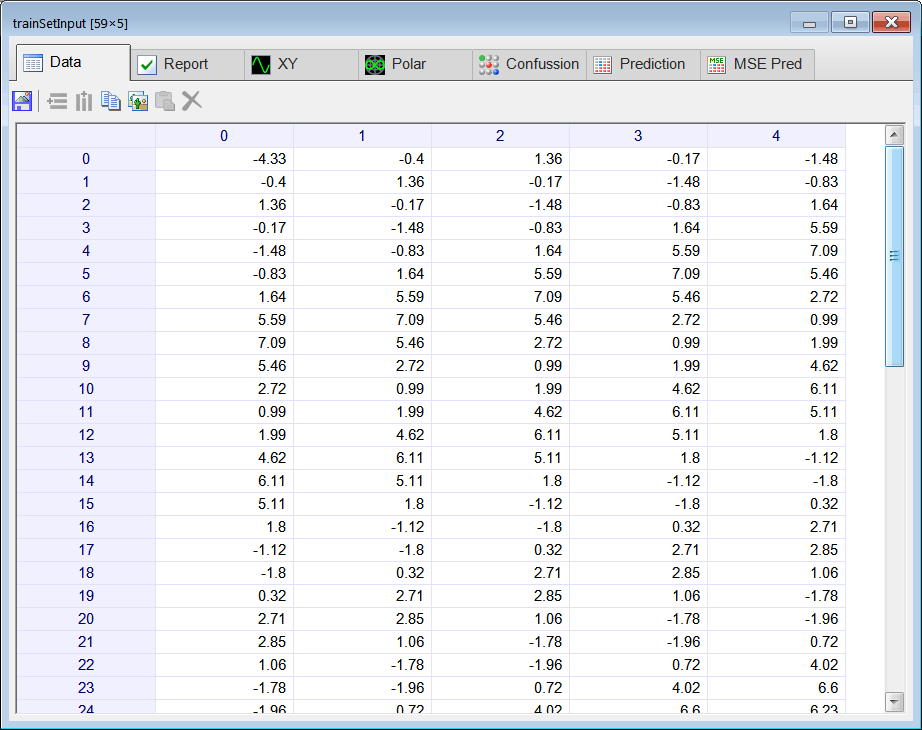
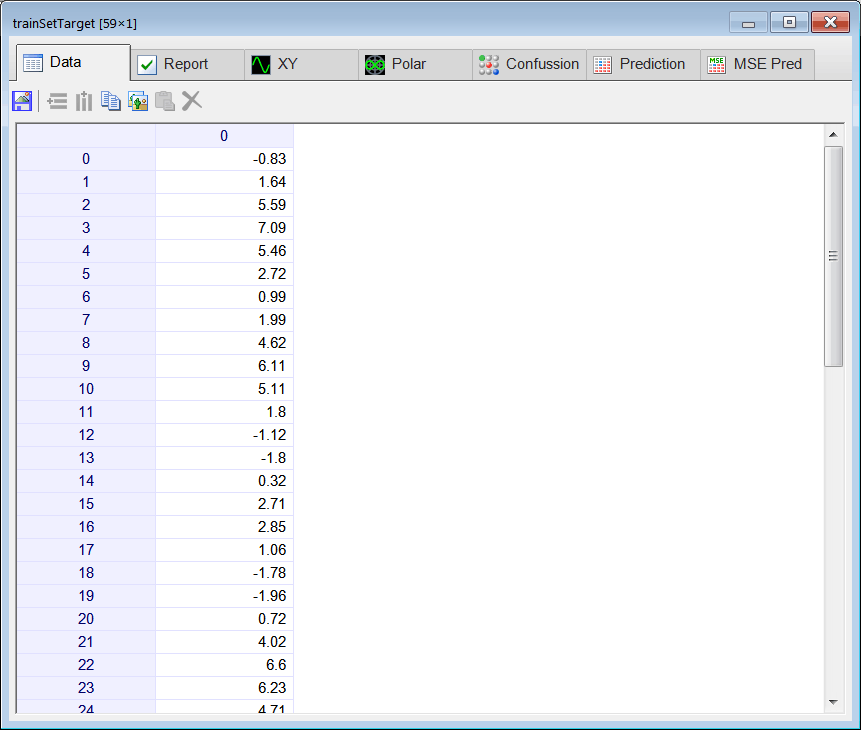
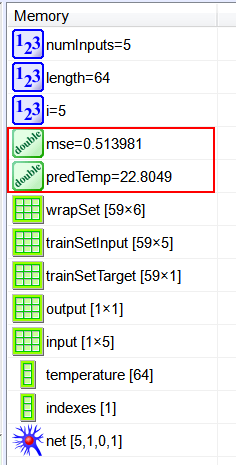
Add a new file called Prediction.lab, then edit the file to add the code shown below.  Run click the button to execute the code. The code creates the wrapped data set (wrapSet). This matrix has 6 columns, the first five columns are for the training set input and the last column is used for the training set target. After the training set has been created, the code creates an ANN with five inputs and one output. The ANN is, then, trained using simulated annealing and the method of Levenberg Marquardt. After the training has been completed, the ANN is excited with the last five values of the series. The output of the ANN is the forecast. Run click the button to execute the code. The code creates the wrapped data set (wrapSet). This matrix has 6 columns, the first five columns are for the training set input and the last column is used for the training set target. After the training set has been created, the code creates an ANN with five inputs and one output. The ANN is, then, trained using simulated annealing and the method of Levenberg Marquardt. After the training has been completed, the ANN is excited with the last five values of the series. The output of the ANN is the forecast. |
| SimplePred\Prediction.lab |
| int numInputs = 5; int numHidden = 1; Vector temperature; temperature.Load(); // int length = temperature.GetSize(); Matrix wrapSet = temperature.Wrap(numInputs+1); // Last column is for the target //_________________________________ trainining set input Vector indexes; indexes.CreateSeries(0, numInputs -1, numInputs ); // 0, 1, 2, 3, 4 Matrix trainSetInput = wrapSet.GetCols(indexes); //_________________________________ trainining set target indexes.Create(1); indexes[0] = numInputs; // last column Matrix trainSetTarget = wrapSet.GetCols(indexes); //_________________________________ Create the network LayerNet net; net.Create(numInputs, numHidden, 0, 1); int i; for(i = 0; i<numInputs; i++) { net.SetInScaler(i, -5.0, 28.0); } net.SetOutScaler(0, -5.0, 28.0); //________________________________ Training net.SetTrainSet(trainSetInput, trainSetTarget, false); net.TrainSimAnneal(100, 100, 15, 0.01, false, 4, 1.0e-12); net.TrainLevenMar(2000,1.0e-12); net.Save(); //________________________________ Compute mse Matrix output = net.Run(trainSetInput); double mse = ComputeMse(output, trainSetTarget); //________________________________ Compute the input to make the prediction (last five values in series) Matrix input; input.Create(1, numInputs); for(i = 0; i<numInputs; i++) { input[0][i] = temperature[length-numInputs+i]; } //_______________________________ Apply the input to the network output = net.Run(input); double predTemp = output[0][0]; // |
| Problem 4 |
| Compute the maximum number of neurons in the hidden layer for the network. |
| Solution 4 |
| Answer 4 neurons |
| Problem 5 |
| Change the number of neurons in the hidden layer to: 1, 2, 3 and 4. Fill the following table by computing the mse and the future value of the temperature (y[64]). Because the series length is 64 (y[0], y[1], y[2] ... y[63]), y[64] represents the forecast value in the series. |
| numHid | mse | Forecast (y[64]) |
| 1 | ||
| 2 | ||
| 3 | ||
| 4 |
| Problem 6 |
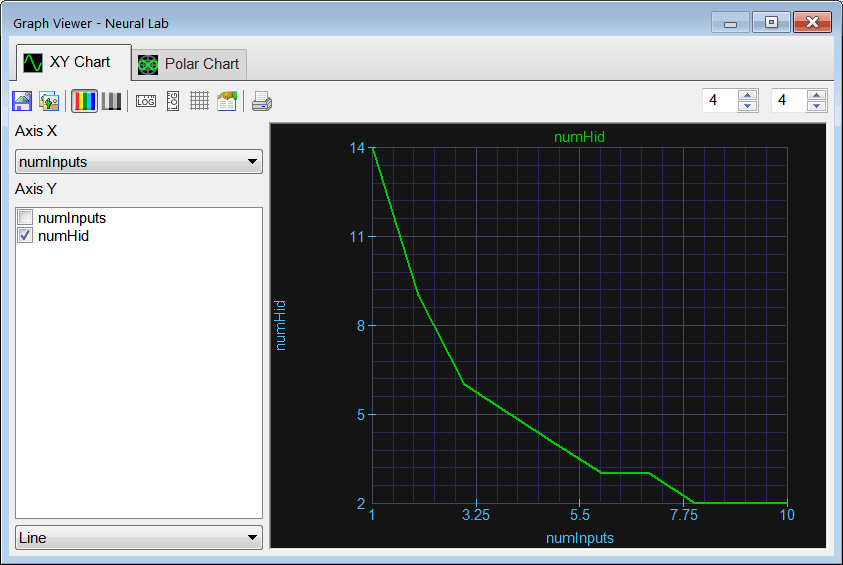
| Suppose that the minimum number of training cases is 2.2 times the number of weights in the hidden layer. Add a code called NumHidden.lab to plot the maximum number of neurons in the hidden layer for an ANN in prediction configuration and the series of problem 1 of length 64. |
| Problem 7 |
| Modify the code to complete the tables below computing the mse for each combination of the number of inputs, and the numbers of neurons in the hidden layer. Write the value of the mse in each cell. In other words, for each combination in the table edit the variables numInputs and numHidden at the top of the code of problem 3 and run the program. Additionally, compute the forecast y[64] for each combination of the number of inputs and the numbers of neurons in the hidden layer. Write the value of the y[64] in each cell. You may use Microsoft Excel to organize your results. |
| numHid = 1 | numHid = 2 | numHid = 3 | |
| numInputs = 5 | |||
| numInputs = 6 | |||
| numInputs = 7 | |||
| numInputs = 8 | OVER-FITTING | ||
| numInputs = 9 | OVER-FITTING | ||
| numInputs = 10 | OVER-FITTING |
| numHid = 1 | numHid = 2 | numHid = 3 | |
| numInputs = 5 | |||
| numInputs = 6 | |||
| numInputs = 7 | |||
| numInputs = 8 | - | ||
| numInputs = 9 | - | ||
| numInputs = 10 | - |
| Problem 8 |
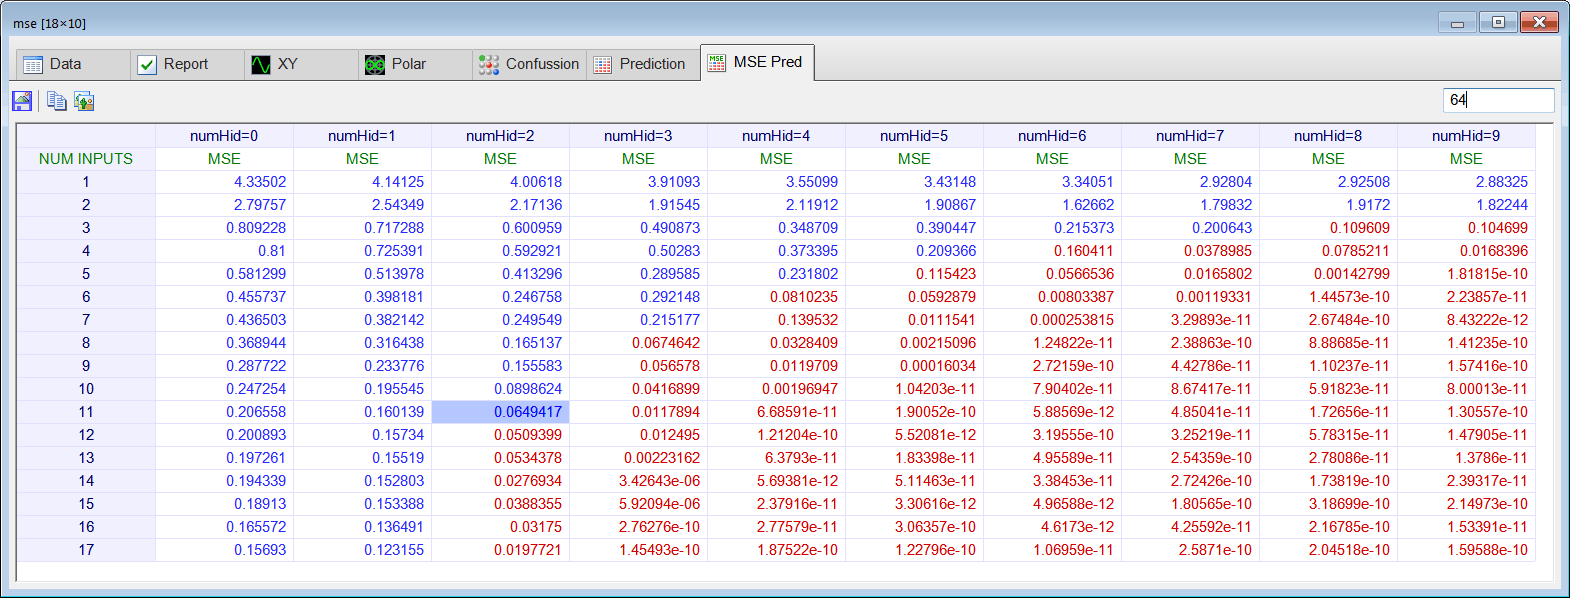
| Create a new file called PredAnalysis.lab to perform the prediction analysis, that is, you code must compute the mse and prediction value for each combination of network inputs and number of neurons in the hidden layer. Your code must generate the mse prediction analysis table, and the value prediction analysis table. Use the sample code shown below. Do not declare variables inside a for, do-while or while block. Once you have designed the code in the PredAnalysis.lab file, run the program. Double click the mse matrix to perform the mse prediction analysis, then click the MSE Pred tab (please provide the series length, 64, to update the report). Once you have reviewed the mse prediction analysis, close it and double click the value matrix to perform the value prediction analysis, then click the Prediction tab (please provide the series length, 64, to update the report). |
| SimplePred\PredAnalysis.lab |
| Vector temperature; temperature.Load(); ... Matrix mse; Matrix value; mse.Create(18, 10); value.Create(18, 10); for(numInputs = 1; numInputs<18; numInputs++) { for(numHid = 0; numHid<10; numHid++) { . . . //_________________________________________ 1. Create trainSetInput . . . //_________________________________________ 2. Create trainSetTarget . . . //_________________________________________ 3. Create the network . . . //_________________________________________ 4. Train . . . net.SetTrainSet(trainSetInput, trainSetTarget, true); //Force training with overfitting for prediction analysis . . . //_________________________________________ 5. Compute mse . . . //_________________________________________ 6. Compute input to make prediction . . . //_________________________________________ 7. Compute prediction value using the network . . . } } mse.Save(); value.Save(); |
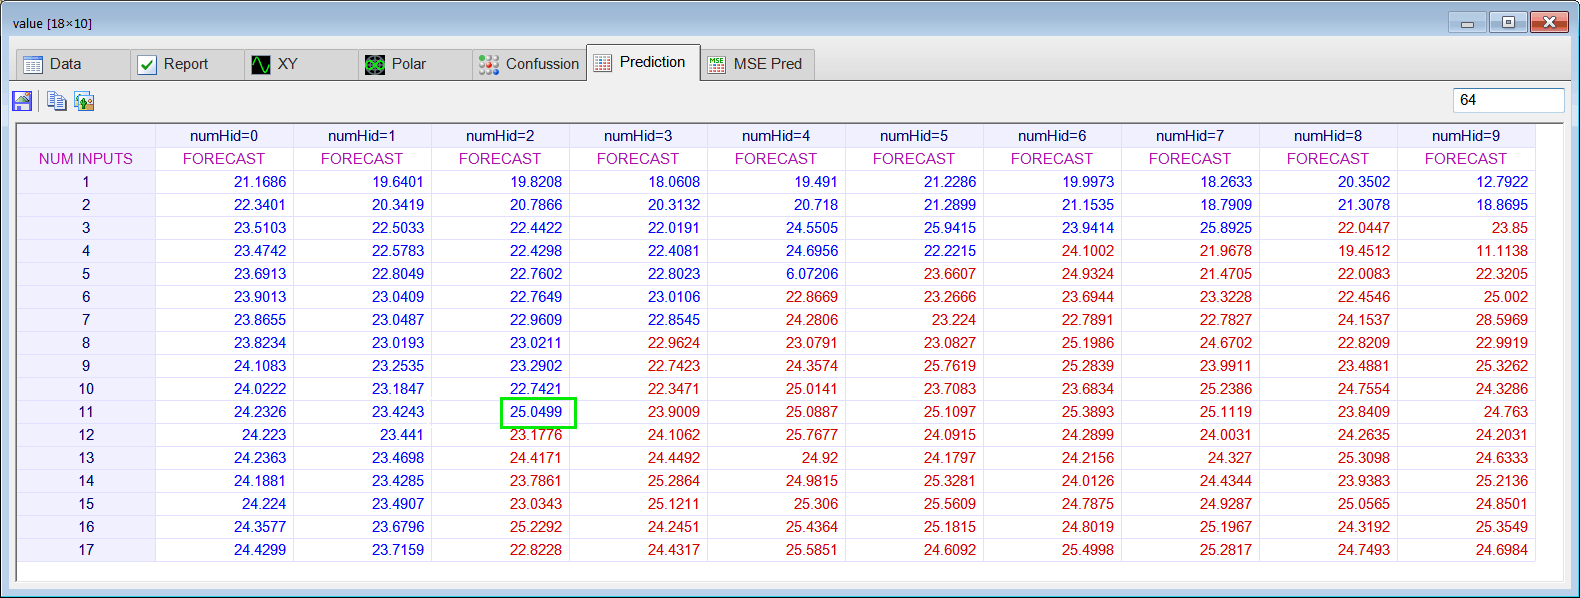
| Series Length | Actual Value | Estimate of y[64] |
| 64 | y[64]=23.75 |
Prediction from Mean Squared Error |
| When performing prediction analysis, you may use the mse.Prediction() function to compute programmatically the row and column of the prediction from a mse matrix. The function takes the series length, and returns a vector with the row and column where the prediction is located. |
| Problem 10 |
| Create a report in Microsoft Word. Write some conclusions in the report indicating the value of the forecast and how it was calculated. |